
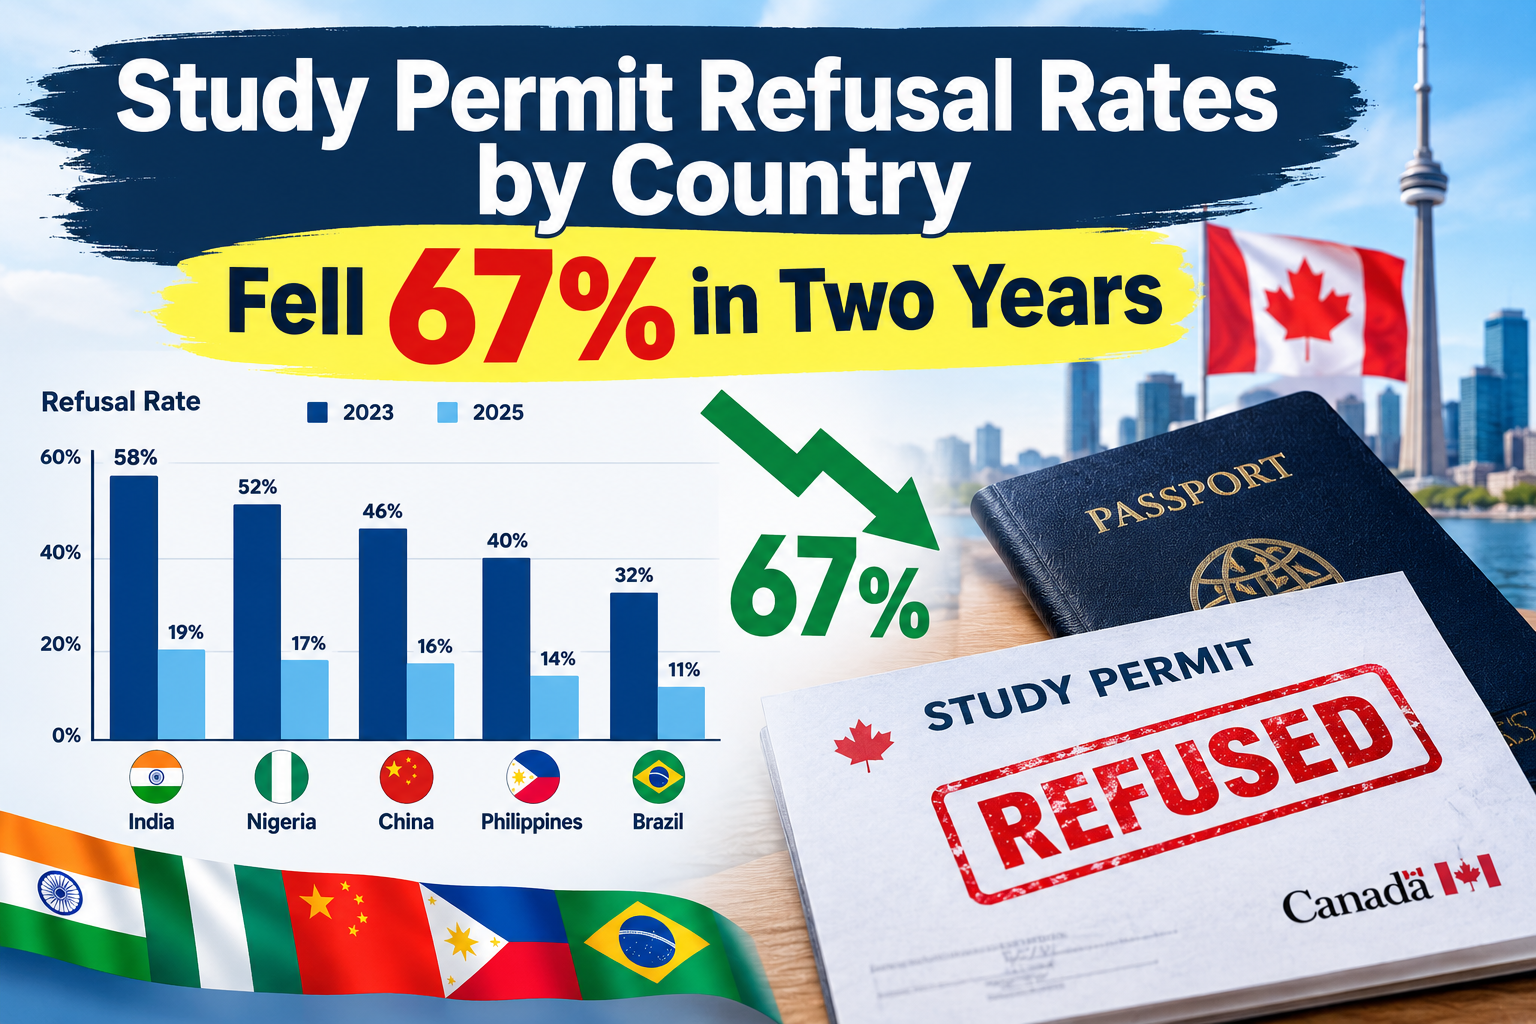
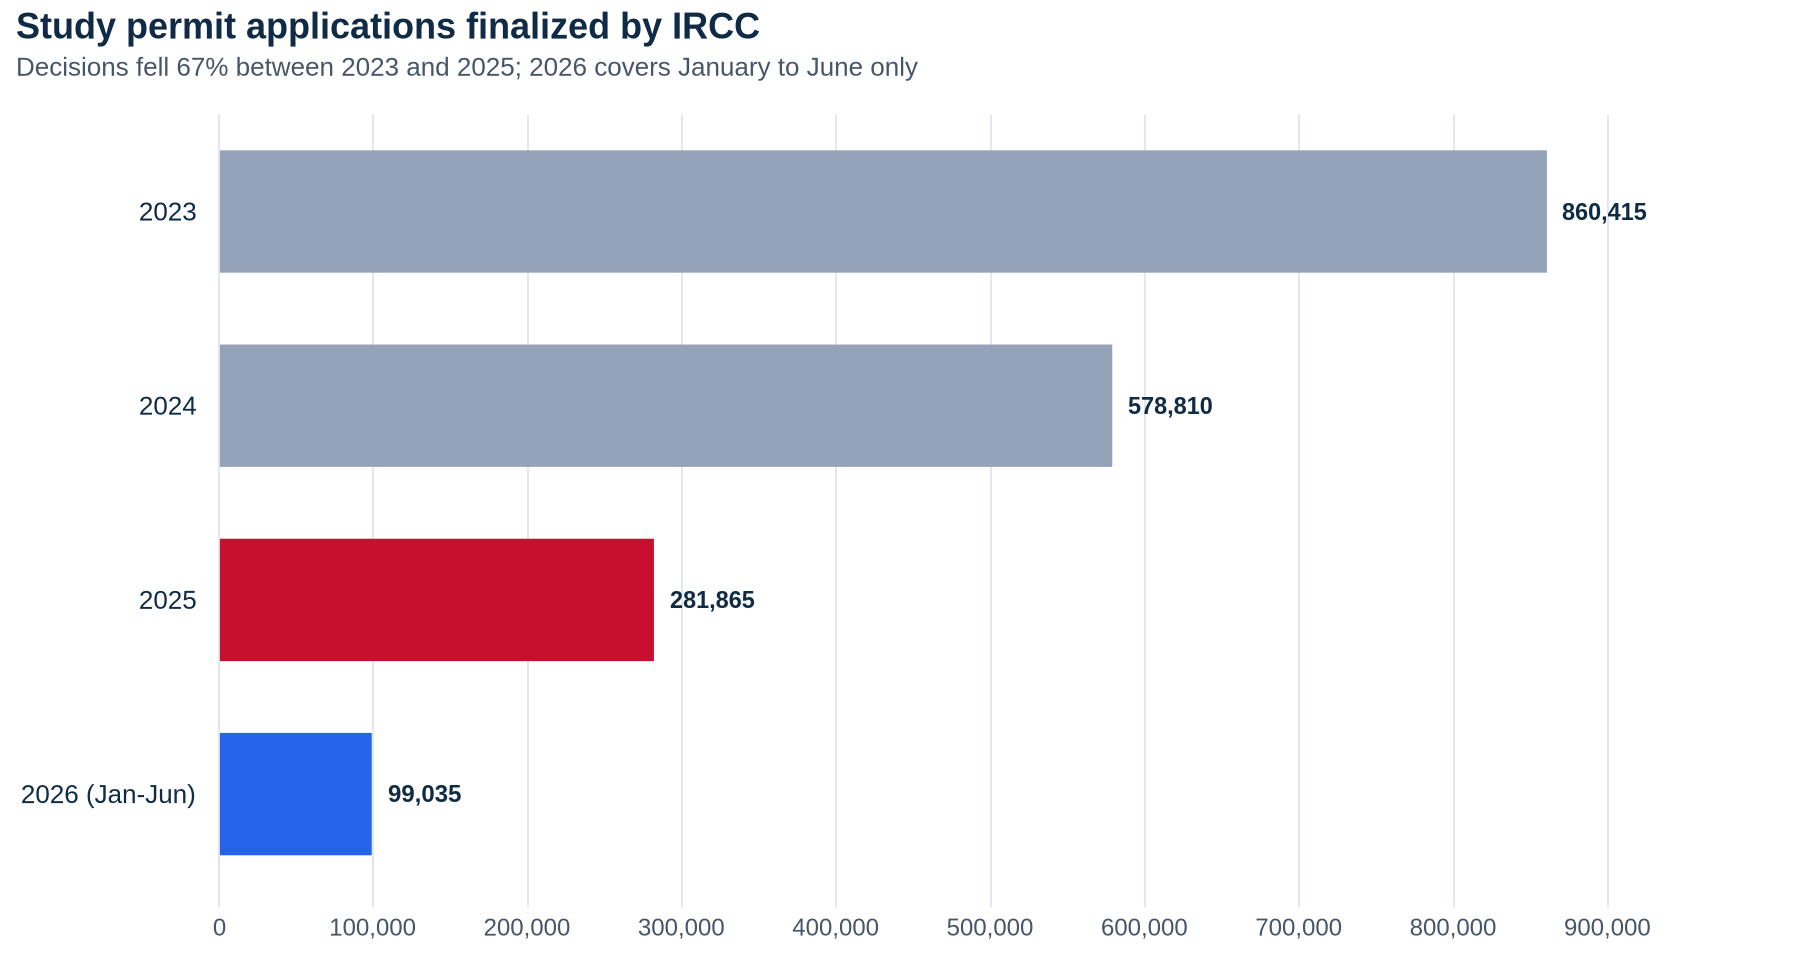
IRCC finalized 860,415 new study permit applications in 2023. In 2025 it finalized 281,865. In the first six months of 2026, 99,035. That is a 67% fall in two years, and it is IRCC’s own count, published country by country and month by month.
This is not a refusal story, and that distinction matters more than anything else here. The figure counts decisions issued — approvals and refusals together. What collapsed is the number of applications reaching a decision at all.
The drop is also nowhere near evenly spread. A handful of countries account for almost all of it, and two of the largest source countries are moving in the opposite direction this year.
What this number actually counts
IRCC publishes this as “applications finalized for new study permit applications.” A finalized application is one that got a decision, whichever way it went. It is not applications received, and it is not permits issued.
So the line falling does not mean more people are being refused. It means far fewer files are entering the system to be decided. The mechanism is the cap: since 2024 a study permit application from most applicants needs a provincial attestation letter, and provinces only issue as many as their allocation allows. An application without one does not get submitted, so it never appears in this table as a refusal — it never appears at all. We covered how those allocations are divided in our breakdown of Canada’s 2026 study permit cap.
Two caveats on the data itself. IRCC rounds every cell to the nearest five, and suppresses small counts entirely, showing them as “–” to protect privacy. That makes the big source countries reliable and the small ones unusable.
India is nearly half the decline on its own
India went from 306,410 finalized applications in 2023 to 49,840 in 2025 — down 84%. Put against the national fall of 578,550 decisions over the same period, India alone accounts for roughly 44% of it. That is our arithmetic on IRCC’s figures, not a number IRCC publishes.
The other steep falls cluster in the same group of high-volume source countries: Nepal down 87%, the Philippines down 80%, Algeria down 70%, Nigeria down 69%.
The countries that held up best are the ones that were never driving the volumes the cap was designed to bring down. China fell 47% over the two years; France fell 14%. If you want the shape of the policy in one comparison, that is it — the cap did not reduce international student intake evenly, it reduced it where the volume was.
2026 is a different picture again
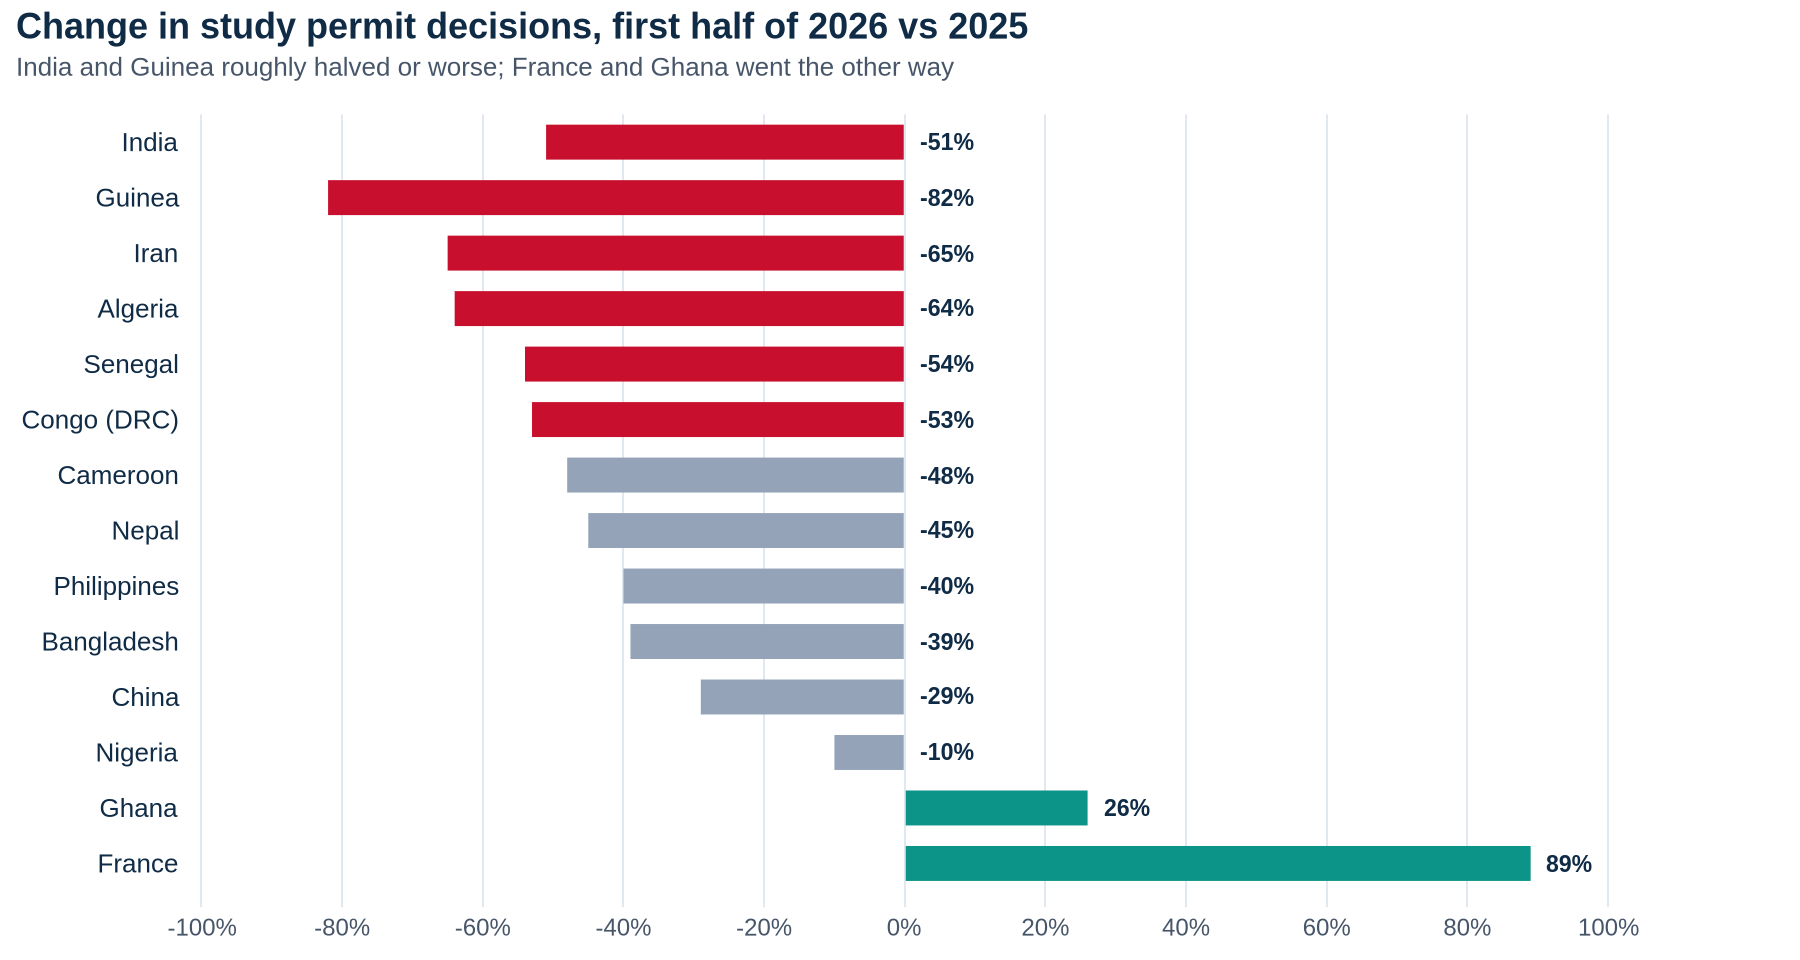
Compare the first six months of 2026 with the first six months of 2025 and the national figure is down about 31%, from 142,540 decisions to 99,035. The decline has slowed, but it has not stopped.
Underneath that, the country pattern has changed. Guinea is down 82% and Iran 65% year over year. India is down another 51% on top of the earlier fall. But France is up 89% and Ghana up 26% — two countries moving against a national decline.
Be careful with why. The data shows what changed, not the reason, and IRCC does not publish one. France rising alongside Canada’s francophone immigration push is consistent with that push working, but consistency is not proof, and one half-year is a short series. Anyone presenting these shifts as a settled explanation is going beyond what the table supports.
Why nobody can give you a refusal rate for your country
This is worth saying plainly, because the internet is full of confident numbers. IRCC’s published country-level data reports applications finalized. It does not break those decisions into approved and refused. There is no public IRCC table of study permit refusal rates by country of citizenship.
The approval-rate figures circulating come from access-to-information releases and private analyses built on them. Some of that work is careful. Most of what gets republished is a single figure, stripped of its year and its methodology, then repeated until it looks official.
The test is simple. If a page quotes your country’s refusal rate and cites “IRCC data” without naming a dataset and a period, it is not coming from IRCC’s published country tables, because that breakdown is not in them. What you can check yourself is volume — how many decisions your country received — which tells you about the size of the pipeline, not your personal odds.
What this means for you
If you are applying from India, Nepal or the Philippines: the competition you are facing is for attestation letters, not for a place in IRCC’s queue. Confirm your institution’s provincial allocation status before you pay any tuition deposit, because that is the gate that closed.
If you are comparing approval rates you found online: ask what dataset the number came from and what period it covers. If the page cannot say, treat the figure as unsourced. It is not a reason to skip applying, and it is not a reason to pay anyone for better odds.
If you are applying from France or another francophone country: you are in the one group whose numbers are rising, which is worth knowing but changes nothing about your file. The requirements are identical.
If you are budgeting a timeline: volume and speed are different things, and a smaller queue has not meant a uniformly faster one. Our look at study permit processing times by country is the companion figure to this one — that is where your wait actually lives.
What to watch next
The dataset updates monthly and currently runs to June 2026. The July to December figures will show whether the 31% year-over-year fall is levelling off or whether 2026 lands below 200,000 decisions — a level Canada has not seen in over a decade.
Watch the 2027 cap allocations too. The provincial split determines how many applications can be submitted at all, which is the number that actually drives this table.
And watch whether IRCC ever publishes decision outcomes by country. Until it does, nobody has a refusal rate for you — including us.
Related reading
- The Same Study Permit Takes 2 Weeks From France and 51 Weeks From Iran
- Canada’s 2026 Study Permit Cap Is 408,000 — And Ontario and Quebec Hold Two Thirds of the Spaces
- Canada Raises Study Permit Proof of Funds to $23,448
All figures come from IRCC’s open data resource “Source Countries — Applications Finalized for New Study Permit Applications by Month,” published on the Open Government Portal and covering January 2023 to June 2026, retrieved September 6, 2026. IRCC rounds every value to the nearest five and suppresses small counts, so totals are approximate. The percentage changes in this article, and India’s roughly 44% share of the national decline, are our own arithmetic on those published figures, not numbers IRCC publishes. This article is general information, not legal advice. Verify current requirements on canada.ca, and speak to a licensed Canadian immigration lawyer or an RCIC in good standing with the CICC about your own application.
Discover more from CanadianUpdates
Subscribe to get the latest posts sent to your email.